Thursday, 10 November 2011

My Tutorial

For the research task the tutorial that made is subject on how to read the xml and then record the  first seven values that is taken from the xml. From there I will step by step  show what node that need to use to read and rewrite the xml. One other skill that is I will be showing in the  tutorial is how to read (breakdown) xml. Showing three main part of xml that need to be read which are the root, child and  attribute.
 For the first part of the tutorial i show how to break down the xml that was download from pachbe .The step that i show in the  video where the location of all the key section of the xml file . Pointing out the root, child and the value xml so that you can feed into the sandbox nodes . Root for most of the file that is download from pachbe  start off the emml as the root.than for the child would be the environment and the "id" is the attribute. The number between current_values is the value.
The second part of the vidoe show  how to read the xml file in sandbox. What i shown in video is the key node that must be use so that the data  feed in. The first node is xml:OpenDocument  which open the file you have download. The next node xml:GetRoot was the get the root of the  is file than after the node xml:GetChild which get the child in the xml file. Than three other node which open the subchild in the child.  last node is to get the value by adding extra  in flow graph the xml first 7 values was record in new xml.
The flow graph recorded the 7 value was last part of the video. This part show how  to create   flow graph that  record down any 7 values that was feed in sand with the first flow graph. The flow graph is in two section when i show how to create it the first is how to create new document and make new child that can recoded the value. so we start off with the node that create the new document which is the xml:NewDocument  from there we use another node that   create the new child that recorded the values this node is xml:NewhChild .From there we want to write down values feed in to the new xml we use the node xml:setvalue . After getting the values from the feed we have to use node to save the xml which h is the xml:saveDocument. From there we open the document again so we can record last six values this done by repearting the node newchild, setvalues, opendocument and save document 6 more time and link each to one another.    

Final engine video

Tuesday, 8 November 2011

Brief and files

 
THE ANALYTICS ENGINE

My analytics engine is a 3 stage processing plant.  It is based on analyzing data and is represented in three different modes and where the final result would have undergone 3 layers of processing.  The data that will be fed into this analytics engine was a live feed in xml format of light Sensors.

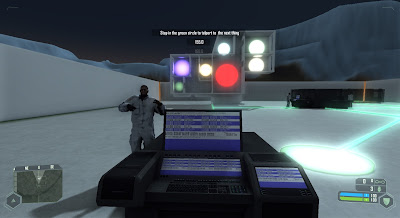
My environment is set up to have 3 laboratories or 3 stations.  They are visually linked by glowing wires to show it’s a series of processing plants. These three stations are interconnected in a way where the information is being processed in three stages.  The information starts off in Station 1. Once its analysed, will then be fed into Station 2 for processing.  Station 3 then gathers the resulting information from Station 2 and processes the final results.

Station 1- analyses the variation in the data and is represented by light.  The light source will
display different intensities depending on the numerical data.  At the same time the numeric data will be displayed in a HUD as it analyses information.

Station 2 – gathers the information from the HUD of Station 1.  This information is divided by 10 where the results are represented by bar graphs.  The heights of the bars are easily visible and the resulting information clearly represented.  This station again produces a HUD display with the resulting data .

Station 3 – this final stage gathers the information from the results in Station 2. This information is further reduced and divided by 10.  The resulting information is represented by the stack of paths in the station.  And the ultimate final result of this series of processing stations  as an analytic engine is displayed on the HUD.

THE LIVE FEED

This live feed is about the light level at curtain time of day in week. 
It can be accessed through https://pachube.com/feeds/35484#graph-builder-container
  
THE MAP AND THE ENGINE 


Monday, 31 October 2011

research

http://www.youtube.com/watch?v=ZcvvtfcbqJk - how to make mini map
http://www.youtube.com/watch?v=qVMxbRjYHnk 
http://benv2423rui.blogspot.com/2011/10/add-child-to-xml-file.html

Week 5 independent study

Research layout 

For the research task the tutorial that I will be making is subject on how to read the xml and then record the  first seven values that is taken from the xml. From there I will step by step  show what node that need to use to read and rewrite the xml. One other skill that is I will be showing in the  tutorial is how to read (breakdown) xml.

week 5


Wednesday, 26 October 2011

Week 4 independent study

For the research task the tutorial that I will be making is subject on how to read the xml and then record the  first seven values that is taken from the xml. From there I will step by step  show what node that need to use to read and rewrite the xml. One other skill that is I will be showing in the  tutorial is how to read (breakdown) xml. Showing three main part of xml that need to be read which are the root, child and  attribute.

Sunday, 2 October 2011

Week 4 tute task

In the engine that i will be making would  be base on the information of the XML should be in two method making it more interesting. this may include the use of playings the hud display which is linked to are object that can show the data of the xml.

Wednesday, 28 September 2011

Week 3 independent studies

How energy like is wasted
How energy is use


what good that light (energy) is good for

Week 2 independent studies

Analytics engine
In the analytics engine that I will be creating would be base in a feed that  was measuring the light that  was pick up by a light sensor. As for the feed it have data collect over the a month of data of light that was pick up by the sensor  where it is place. The relation of the feed and the analytics engine is that by reading the xml file in the engine by using the xml node to read  data within the xml display with one of the object that custom or premade  in the game. Most like the use of the light in the engine would be suitable due to the xml is data is on light. As for light being  display would be on stage or a house it will be control by the xml data. This mean the light would be turn off and on by reading the data or the other light can be turn on more brighter. by combining the flow graph  from the  tutorial we can see  what is the output of the data from the feed on new xml show just whole number.

flow graph to import the xml datd

Week 2 tute task

Week one independent studies

Week one tute work

Saturday, 27 August 2011

Marking sheets

Links

All link link to project

Pure war game mod


Pure war sketch up model 


Video link

video upload of the final Installment


Music:
"METAL GEAR SOLID" Main Theme (METAL GEAR SOLID 3 Version) 
Contributing Artists:Harry Gregson-Williams
Album Artist:KONAMI
Copyright:Konami Media Entertainment. Inc

Image text:
Pure war by Paul Virilio 1997 

Video capture:
Sandbox editor Crytek  

starting the game at some point of the game and time

playing music at set time

open the gates

turning the light on

spawning grunt at set time


Outline of the installment


Timeline to war

In this installment what I have created is real-time, this timeline shows what's happen in each period during war. The installment is broken up into three section and has it's sub routine that plays in the timeline. The modes that was used in the installment includes light, time of day, music ,snow and rotating.
The main mode that is related to the  pure war and real time static is the three light that turned on at pre set period that  it is allocated. The light is broken up into three groups, the first group is the pure war period which has yellow light which lights up the supplies that represents getting prepared  for war  with barrel supply and the weapons. From there we use the  red light which is the time of war which I   spawned grunt and shooting at each other. Near the end there is an explosion where all the grunt are killed which is done by the flow graph that kills them at the set time to show result of  war. As for the last light which is green I have gates open and music  playing. At the same time the sun rises like a new day which represents of peace.      

video update on Pure war Installment


Tuesday, 23 August 2011

Rain!!!!!!!!!!!!!!

part one video show rain stop around 7 and start again
part two show how the rain can change it down pour

TIme of day Light video


scale video


when going up close to the building the building scale up when going away the building scale turn to original size.

Tuesday, 9 August 2011

Barrel

For this model it is shape like a  barrel which is use during time war and when we not war. It have many use at the time of war it one of most use item. The use of the barrel can range from  storing weapon, toxic waste and other war related item like. As for the use of the barrel when at peace is the food stock, water and  living related item.      

Sunday, 7 August 2011

Object glow vid

 
The closer you get the more the barrel glows and farther you go the glow disappears. 

Thursday, 21 July 2011

Real time statistic

Tokyo Japan Power Usage

http://pachube.com/feeds/21383

 In this live feed found it interesting to found that in Tokyo  the lost time of using power is around 2 where the power hit lost point shot up in few hours.I was expecting that people in japan would use lot more power than Australia rarely drop it the use power because they are high tech country.